Figure 455 — Structural members and actions
| Format | ASCII | HTML |
|---|---|---|
| IFC-SPF | File | Markup |
| View |
|---|
| Common Use Definitions |
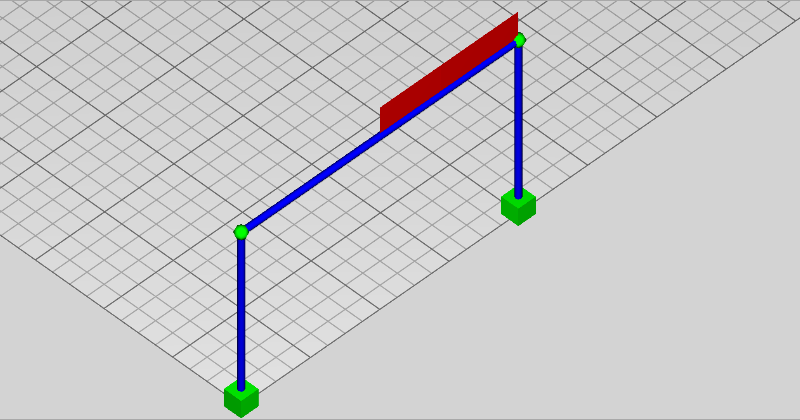
This example includes three structural curve members forming a simple frame, and a single load case of a linear distributed load.
The example includes three structural curve members connected in series, forming two columns and a beam, where the columns have rigid boundary conditions with respect to the ground. Each curve member has a material profile set defined using an I-Shape profile of steel material. The profile has properties indicating area and moments of inertia. The material has properties indicating density, modulus of elasticity, modulus of rigidity, and yield strength. One load case is defined, having a constant linear distribution over half of the beam. See Figure 455 for the geometric and topological representation of the structural members.
|
|
|
Figure 455 — Structural members and actions
|
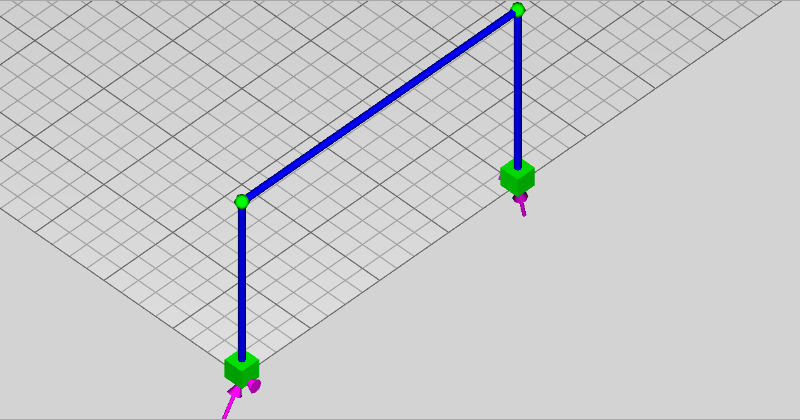
The load case has calculated results included, consisting of point forces and moments at each point connection on the ground. See Figure 456 for the represenation of the structural members with reactions.
|
|
Figure 456 — Structural members and reactions
|
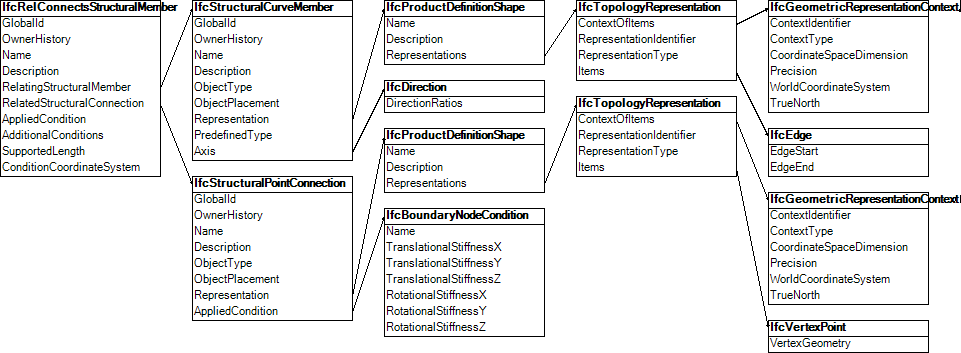
The IfcRelConnectsStructuralElements relationship links a curve member to a point connection. See Figure 457 for an instantiation diagram.
|
|
Figure 457 — Structural connection graph
|
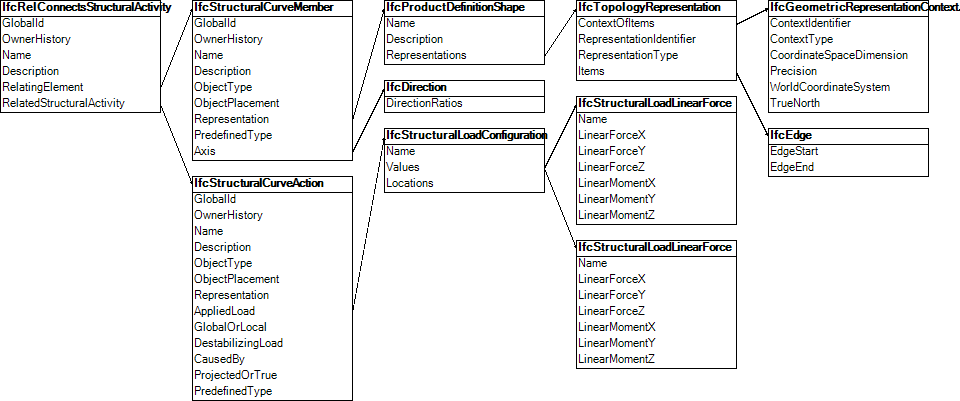
The IfcRelConnectsStructuralActivity relationship links a load action to a curve member. See Figure 458 for an instantiation diagram.
|
|
Figure 458 — Structural load graph |
 Link to this page